

Integrate LibreDB Studio with Tiger Cloud
Query, browse, and administer your database from a web-based, multi-engine database editor
LibreDB Studio is an open source, web-based database editor that runs as a self-hosted server or a local CLI (npx @libredb/studio), with a query editor, an object browser, and a monitoring dashboard shared across PostgreSQL and more than a dozen other database engines.
This page explains how to integrate LibreDB Studio with your Tiger Cloud service.
In this integration guide, you:
- Connect LibreDB Studio to your service over the standard PostgreSQL wire protocol.
- Browse your schema and run queries from the LibreDB Studio editor.
- Review what LibreDB Studio's object browser and monitoring dashboard show for a hypertable, and where those views diverge from a plain table.
Prerequisites for this integration guide
To follow these steps, you'll need:
-
These steps use Tiger Cloud, but the same approach applies to a self-hosted TimescaleDB instance.
- Your connection details.
- LibreDB Studio installed. Run it locally with
npx @libredb/studio, or deploy the Docker image or Helm chart to a server you control.
Connect LibreDB Studio to your service
Section titled “Connect LibreDB Studio to your service”To connect to Tiger Cloud:
- Start LibreDB Studio and sign in
Open LibreDB Studio in your browser and sign in with the admin or user account configured for your instance. On the first local run,
npx @libredb/studioprints a generated admin email and password in the terminal.An admin account lands on the
Admin Dashboard. ClickEditorin the top-right corner to open the query editor. - Open the connection dialog
Click the
+button next to the LibreDB Studio logo in the sidebar to open theNew Connectiondialog. - Select PostgreSQL as the connection type
LibreDB Studio has no separate TimescaleDB connection type: TimescaleDB is a PostgreSQL extension, so the
PostgreSQLdriver is the correct choice and connects over the same wire protocol. - Configure the connection
Fill in the connection name and use your connection details for the host, port, database name, username, and password. Enable
SSL / TLSif your service requires it. - Click
Test Connection, thenEstablish ConnectionA successful test reports the round-trip time, for example
Connected successfully (26ms).Establish Connectionsaves the connection and opens it in the editor, with the object browser populated on the left.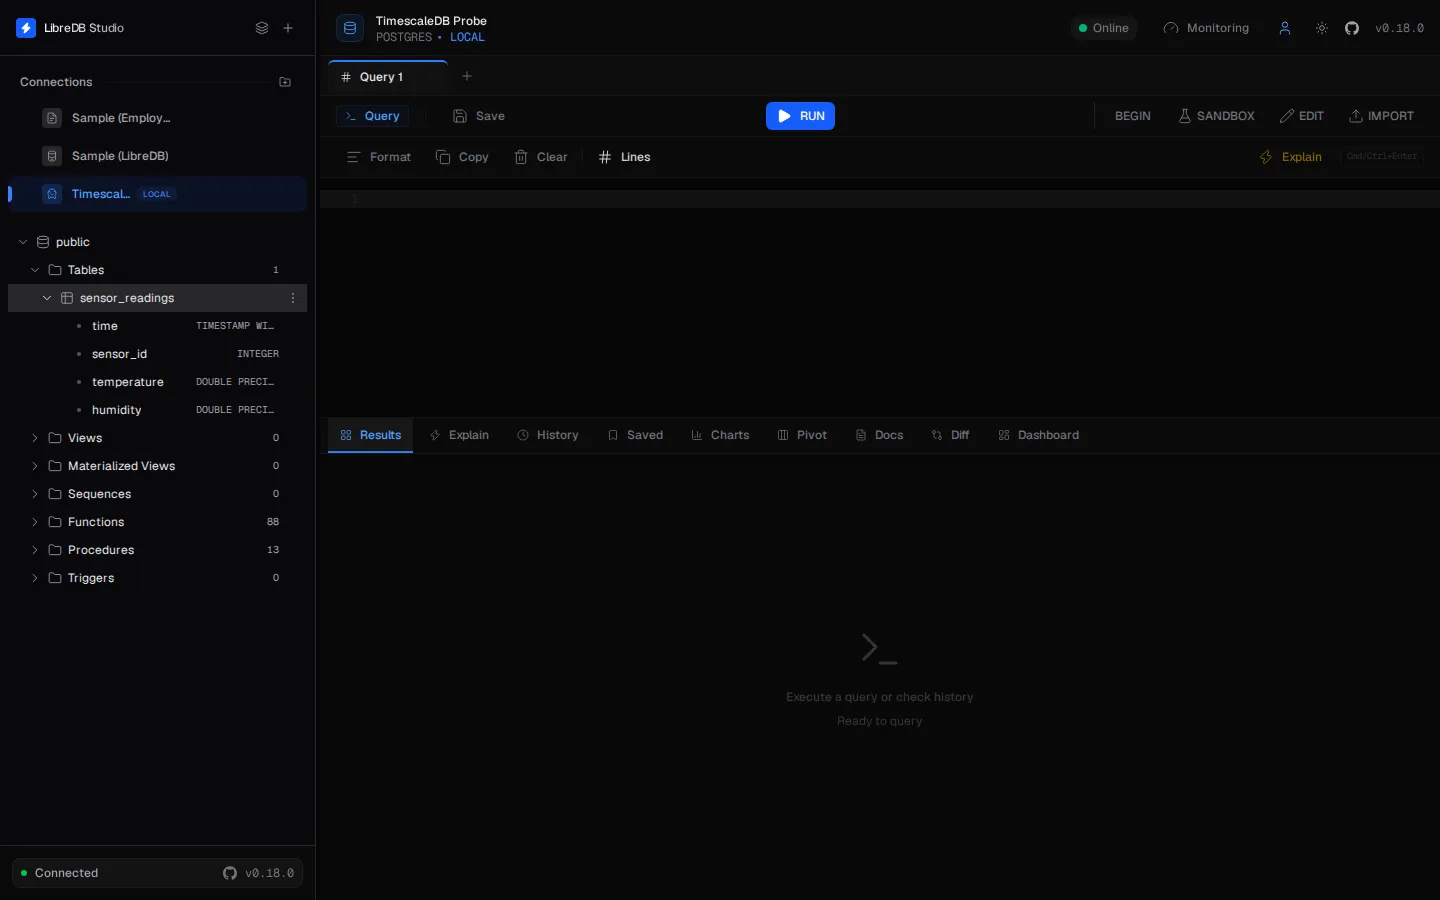
You have successfully integrated LibreDB Studio with Tiger Cloud.
Verify the integration
Section titled “Verify the integration”- Run a query against a hypertable
In the query editor, run a
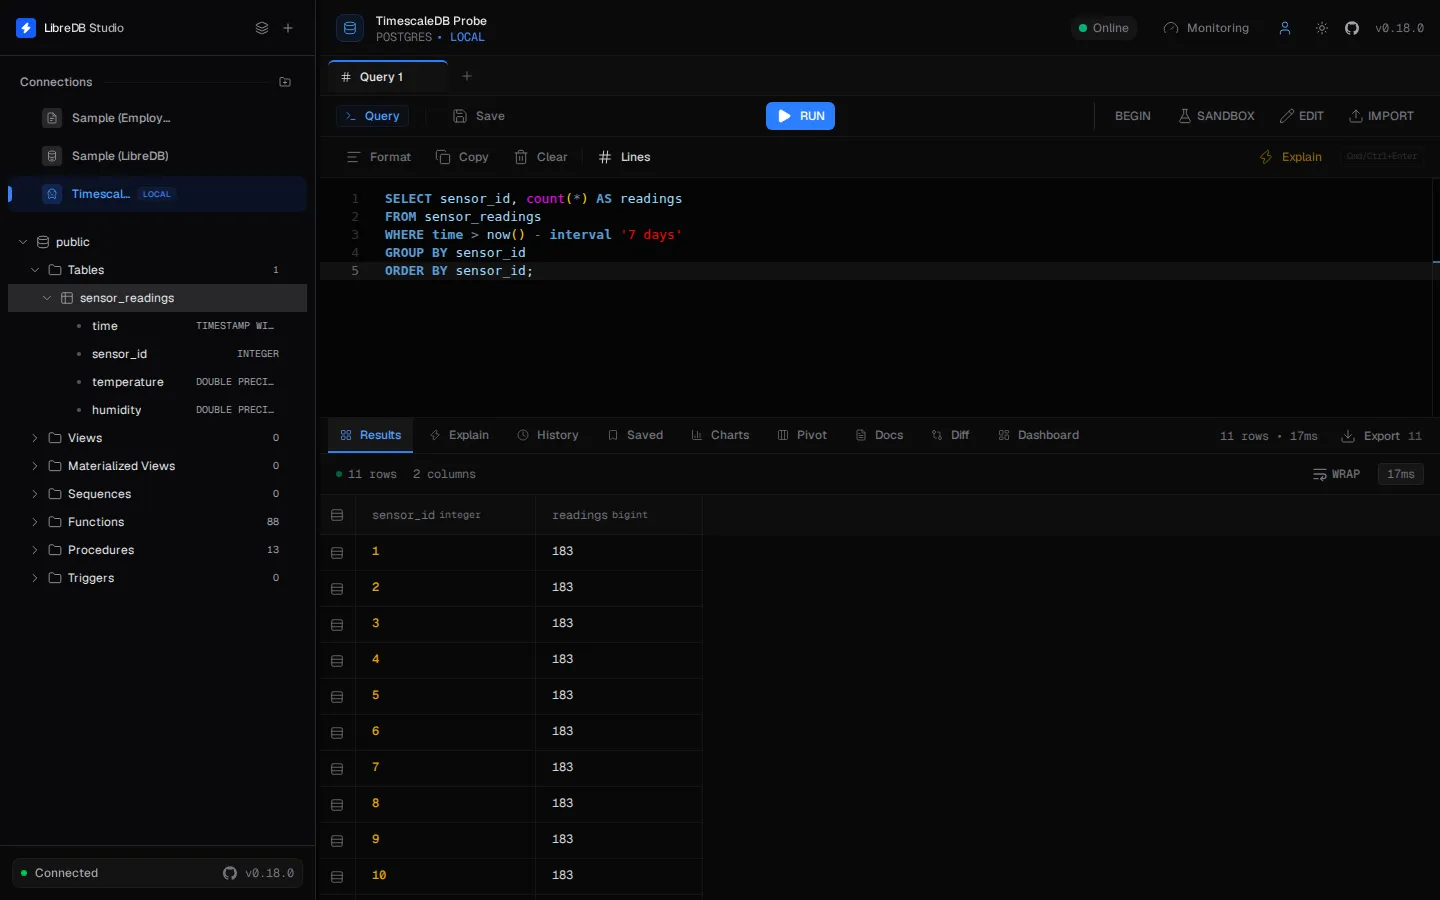
SELECTagainst one of your hypertables, for example:SELECT sensor_id, count(*) AS readingsFROM sensor_readingsWHERE time > now() - interval '7 days'GROUP BY sensor_idORDER BY sensor_id;The results grid renders the rows, with the row count and execution time shown above the grid.
- Browse the schema
In the object browser, expand your schema, then
Tables. Your hypertable is listed as a single table, the same way a regular table is: its chunks and the internal_timescaledb_*schemas are not shown. Expand the hypertable to see its columns and their types. Indexes aren't listed in the tree; their size appears in theIndexcolumn of theMonitoring>Tablesview.To find a table by name, press
Cmd+Kon macOS orCtrl+Kon Linux and Windows to open the command palette, and type the name. The object browser has no search box of its own.
Limitations
Section titled “Limitations”TimescaleDB stores a hypertable's rows in per-interval child tables (chunks) and keeps the parent table itself empty. LibreDB Studio's object browser and monitoring dashboard read table size and row count from PostgreSQL's own catalog statistics, the same source a plain PostgreSQL client would use, and that catalog describes the empty parent, not the chunks underneath it. Measured against a hypertable with 8,641 real rows across 31 chunks:
-
The
Table Statisticsview reads 0 rows and 0 bytes for the hypertable. Open it fromMonitoring>Tables. The index is not affected: it reports a non-zero size. The hypertable's row count next to its name in the object browser is also missing until the table is analyzed, and reads 0 afterwards.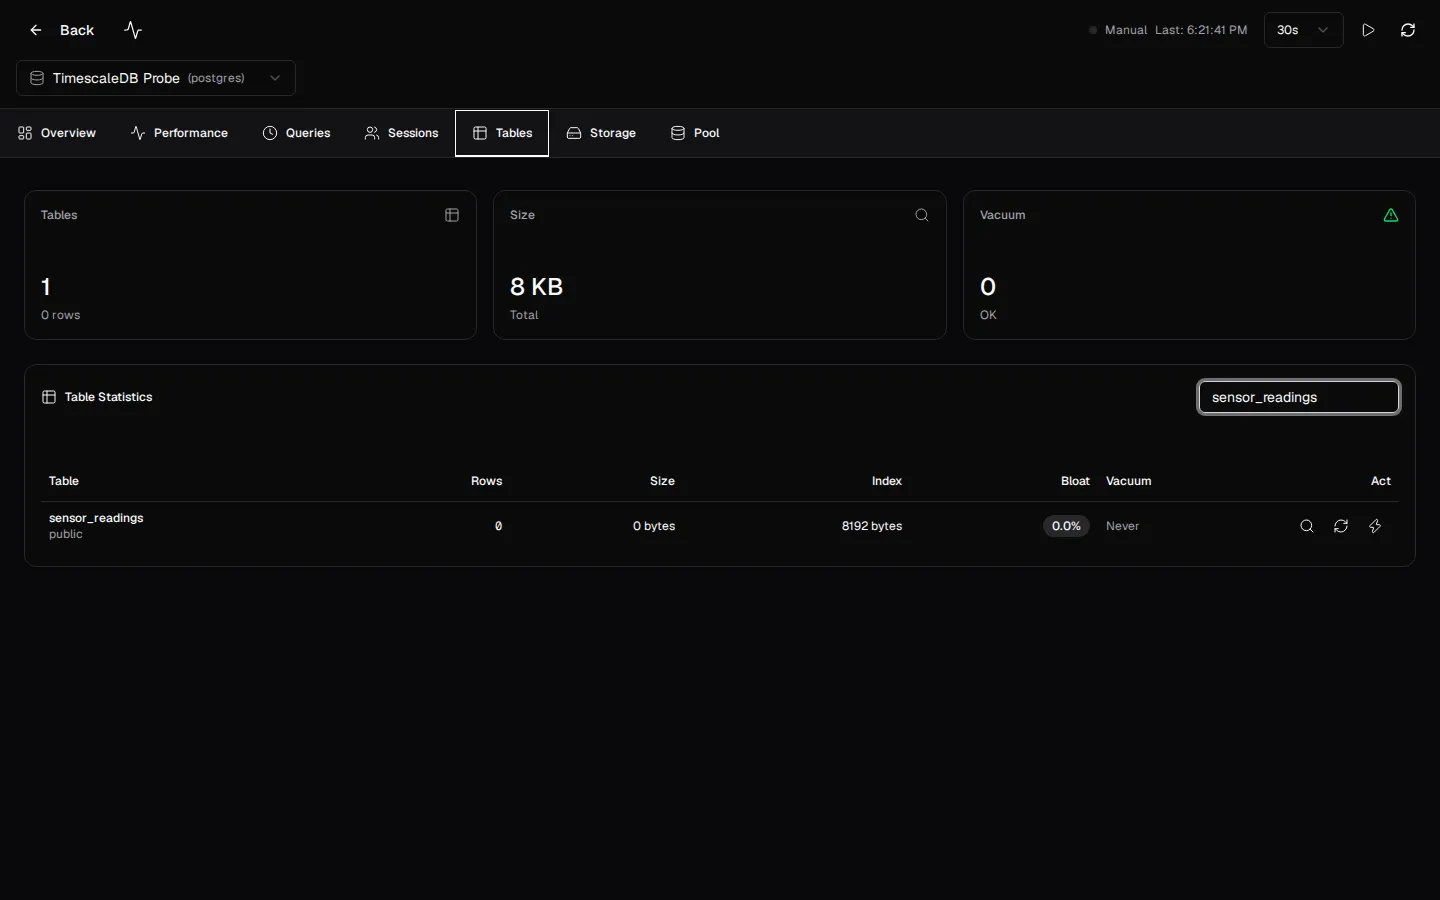
-
A direct query or
Profile Tablereports the true row count. ASELECT count(*)run in the query editor returns the real number. So doesProfile Table, in the⋮menu next to the table's name in the object browser, because it runs its own scan rather than reading catalog statistics.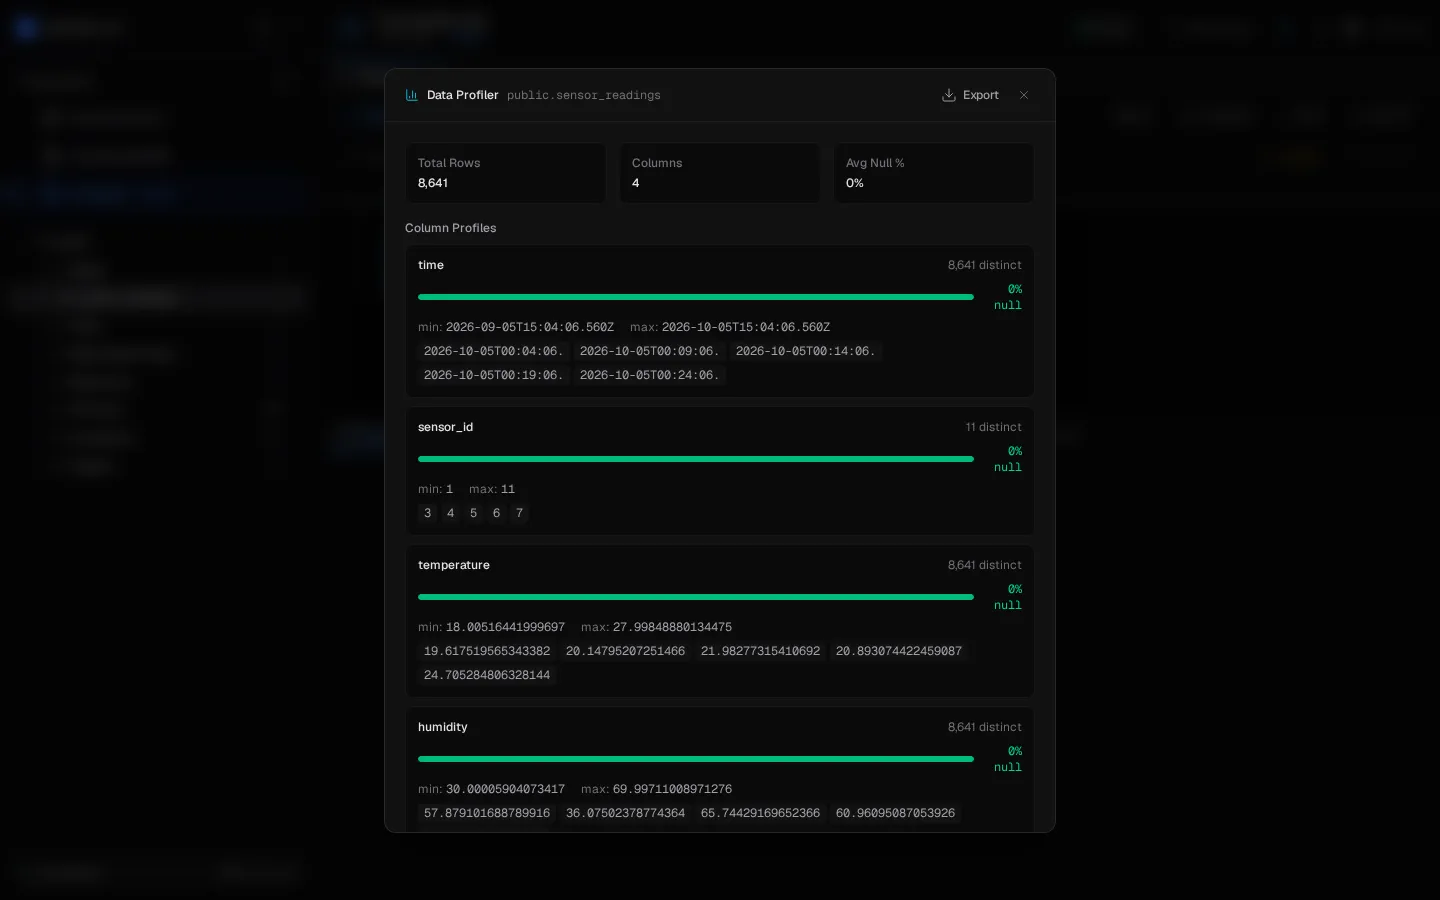
-
The overview and monitoring pages show the PostgreSQL version, not the TimescaleDB extension version. A service running
TimescaleDB 2.30.2 on PostgreSQL 17.11shows only thePostgreSQL 17.11version string.
None of this blocks querying or browsing a hypertable, an ordinary SELECT returns real data and real row counts either way, but the passive statistics shown in the browser and dashboard undercount a hypertable specifically. Query directly (count(*), hypertable_size(), or Profile Table) when you need an accurate number.